Live Monitoring Dashboard: Real-Time Chat Analytics & Performance Insights
Comprehensive guide to the live monitoring dashboard featuring real-time chat metrics, agent performance tracking, wait times analysis, and customer feedback insights for optimal customer support management.
Live Monitoring Dashboard Overview
The live monitoring dashboard provides comprehensive real-time insights into your customer support operations. This powerful tool is organized into four main sections that give you complete visibility into chat flows, agent performance, and system efficiency.
🔴 Real-Time Monitoring Data
Track active conversations and system status with live metrics that update automatically:
Chat Status Metrics
Ongoing Chats
- Total number of conversations currently active in your system
- Includes all chat types and statuses for complete visibility
Bot Chats
- Conversations currently being handled by automated chatbots
- Monitor bot effectiveness and handoff patterns
No Rule Matched
- Conversations that haven't triggered any assignment rules
- Identify potential gaps in your routing configuration
Waiting for Assignment
- Chats in the assignment queue awaiting agent allocation
- Critical metric for managing customer wait times
Open Chats (Assigned)
- Active conversations assigned to agents
- Track current agent workload distribution
Awaiting Response
- Chats where customers are waiting for agent replies
- Monitor response time performance in real-time
Pending
- Conversations in pending status requiring attention
- Ensure no chats fall through the cracks
👥 Agent Status Overview
Monitor your team's availability and capacity:
Active Agents
- Agents currently online and available for chats
- Real-time headcount of your available support team
Busy Agents
- Agents marked as busy or at capacity
- Track when your team is fully utilized
Offline Agents
- Agents who have logged out or marked themselves unavailable
- Monitor staffing levels and plan coverage accordingly
⏱️ Wait Time Analytics
Key Wait Time Metrics
Average Wait Time
- Mean time customers wait for agent assignment today
- Critical customer experience indicator
Maximum Wait Time
- Longest wait time recorded for the current day
- Identifies peak stress periods requiring attention
Wait Time Distribution Analysis
Track how efficiently chats are being assigned throughout the day with detailed time interval breakdowns.
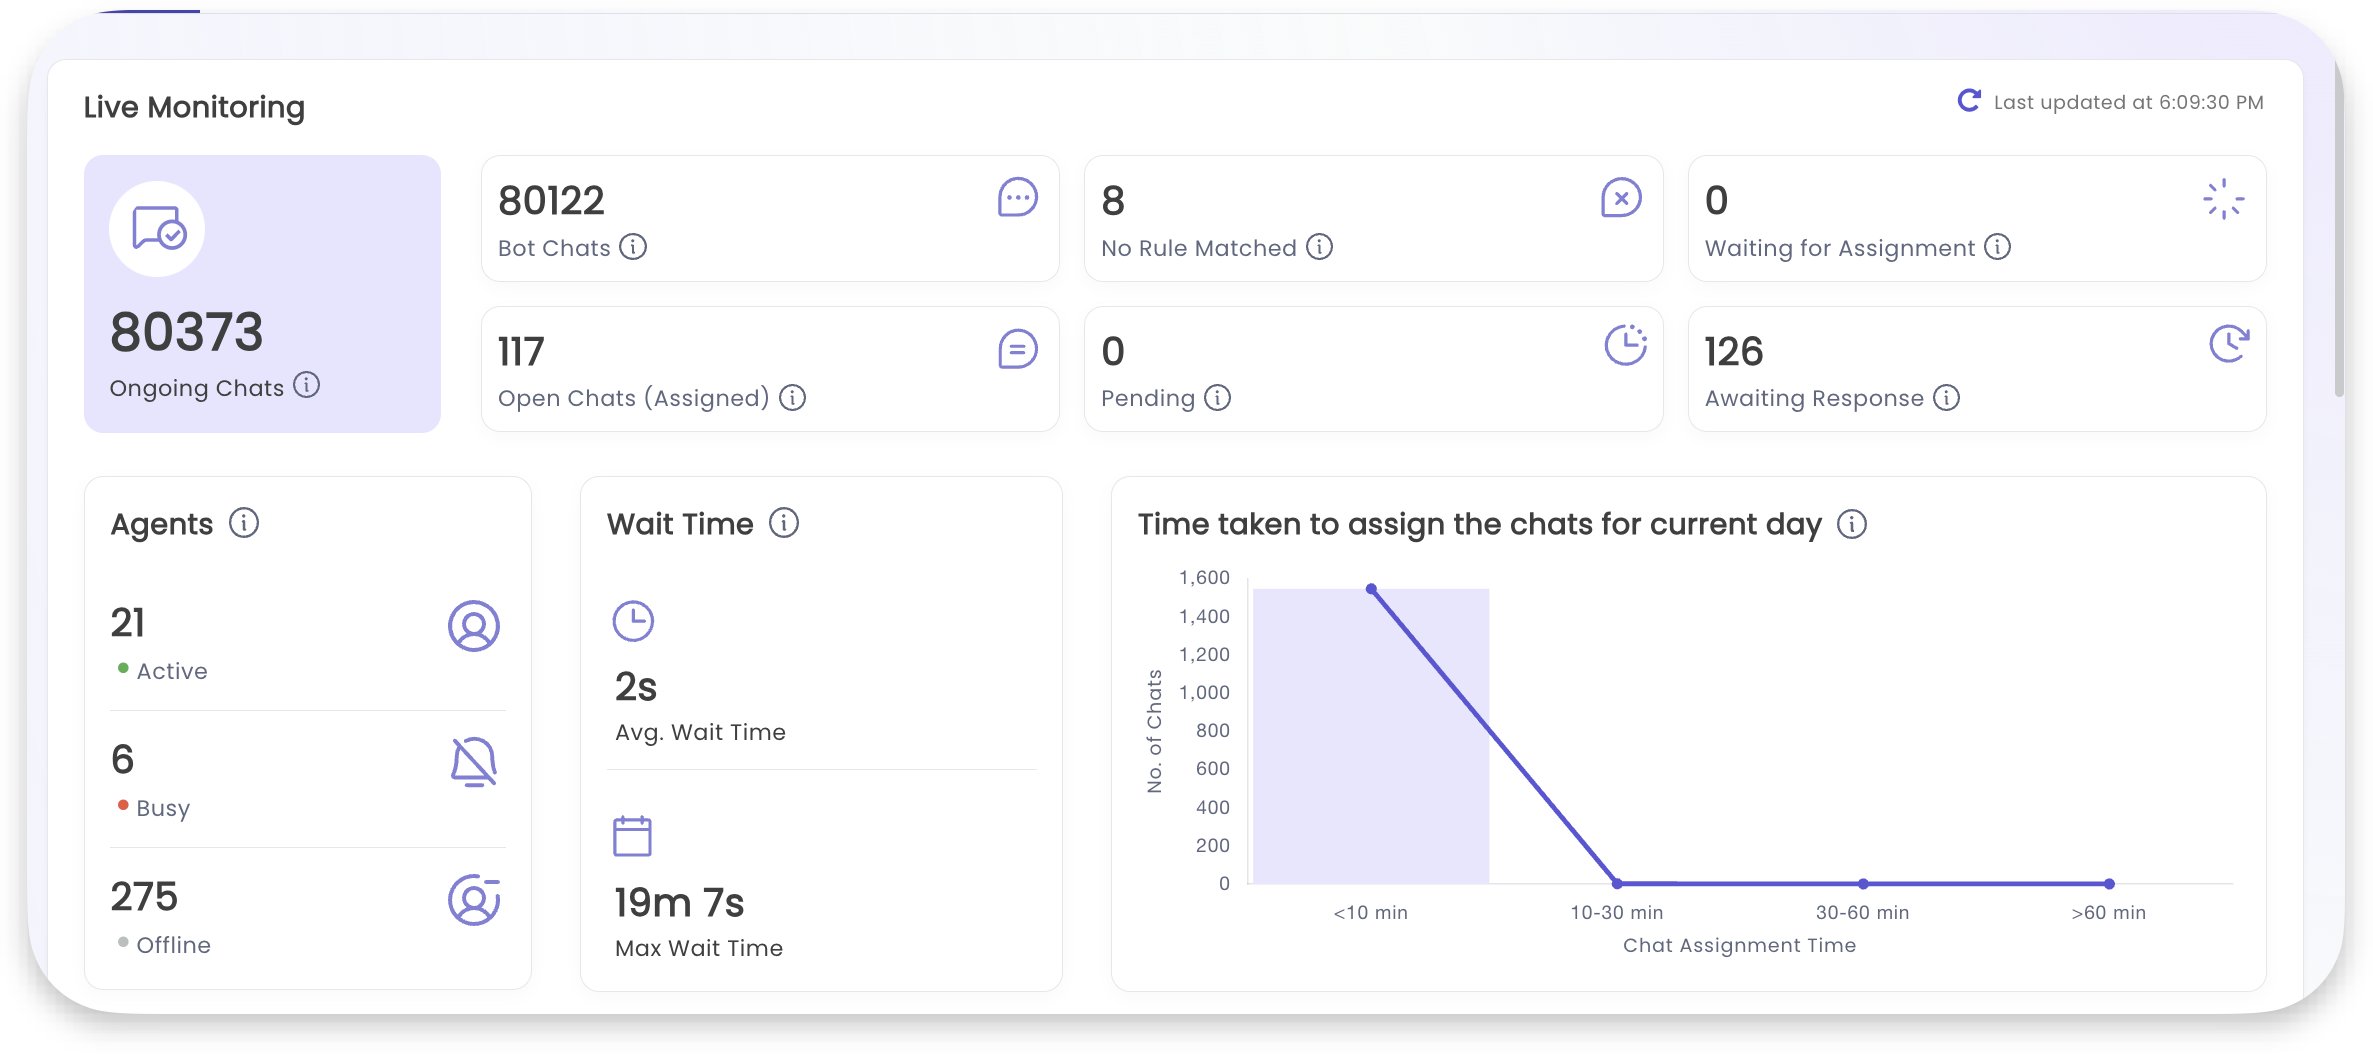
This visualization shows:
- Distribution of assignment times across different intervals
- Peak assignment periods
- Opportunities for optimization
📊 Daily Chat Creation Trends
Monitor chat volume patterns and assignment efficiency with comprehensive daily analytics.
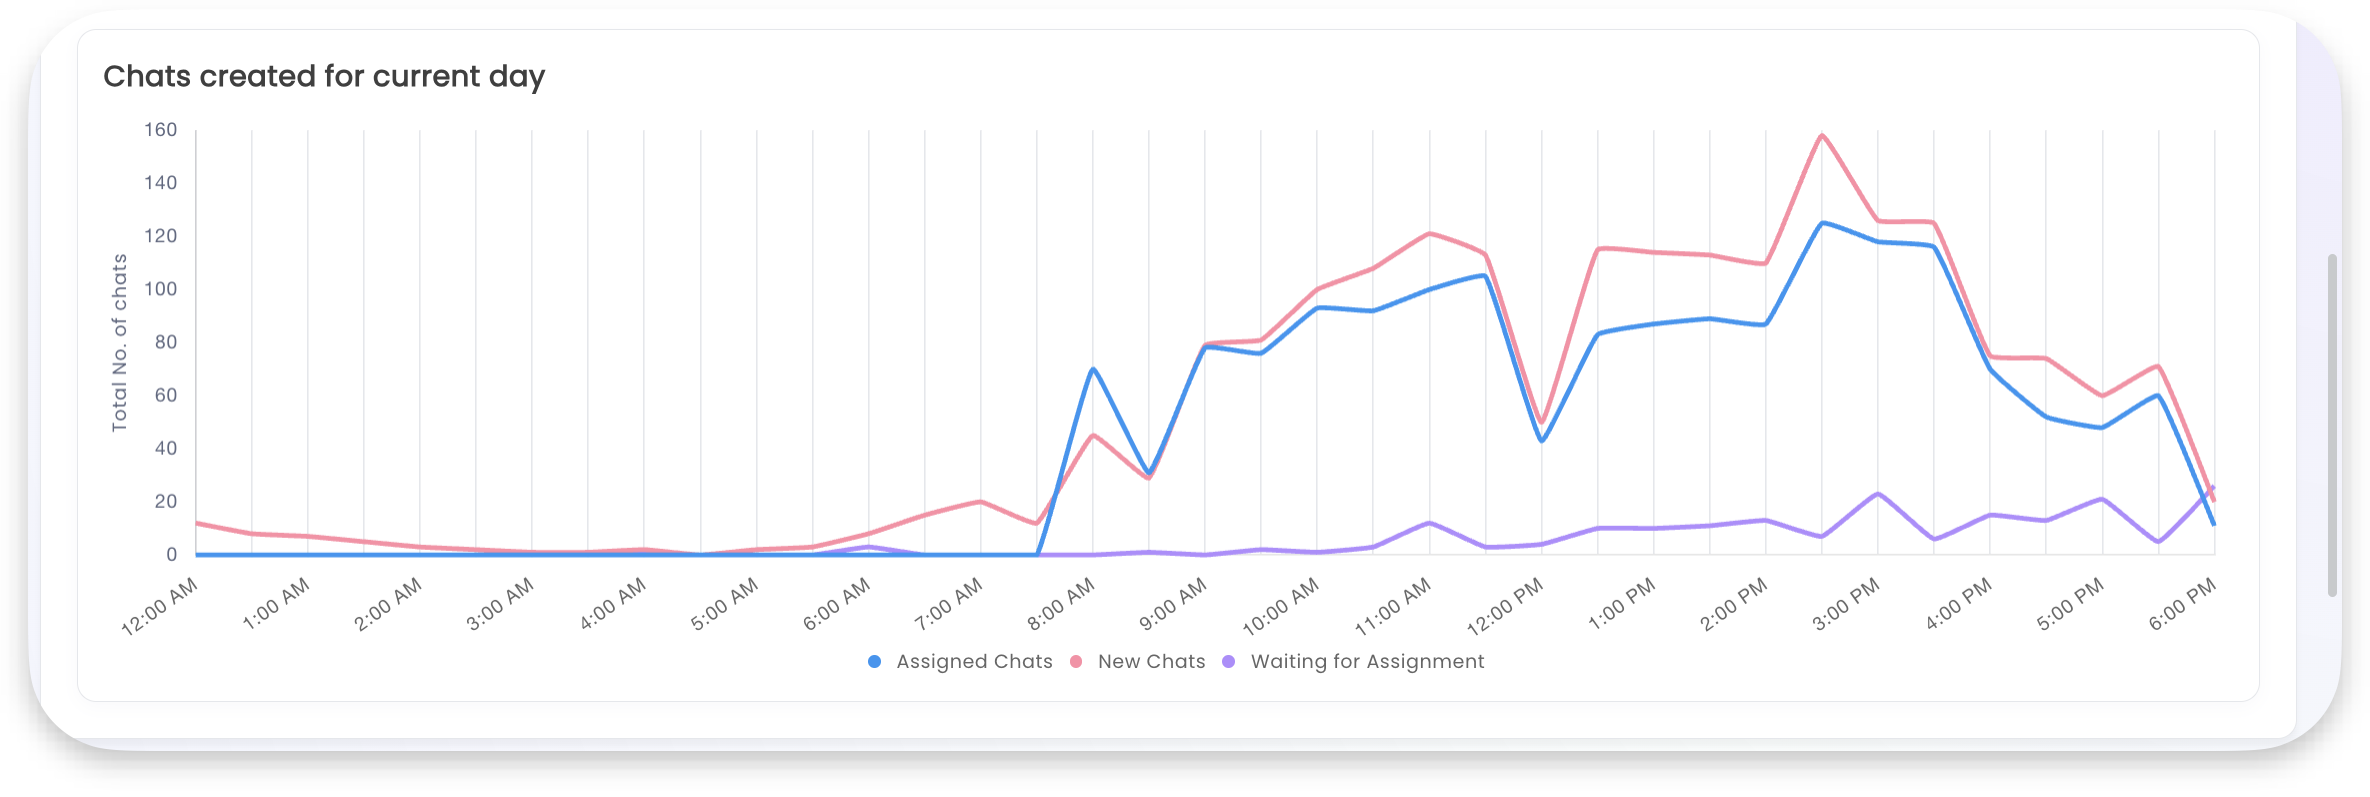
This graph provides insights into:
- Chat Creation Patterns: When customers initiate conversations
- Assignment Queue Dynamics: How chats move through your system
- Peak Volume Periods: Times requiring additional staffing
📈 Key Performance Indicators
Response Time Metrics
Average First Response Time
- Time from chat assignment to agent's initial response
- Critical for first impression and customer satisfaction
Average Response Time
- Mean time for agents to respond to ongoing customer messages
- Indicates overall conversation flow efficiency
Average Resolution Time
- Time from chat start to successful resolution
- Measures overall support process effectiveness
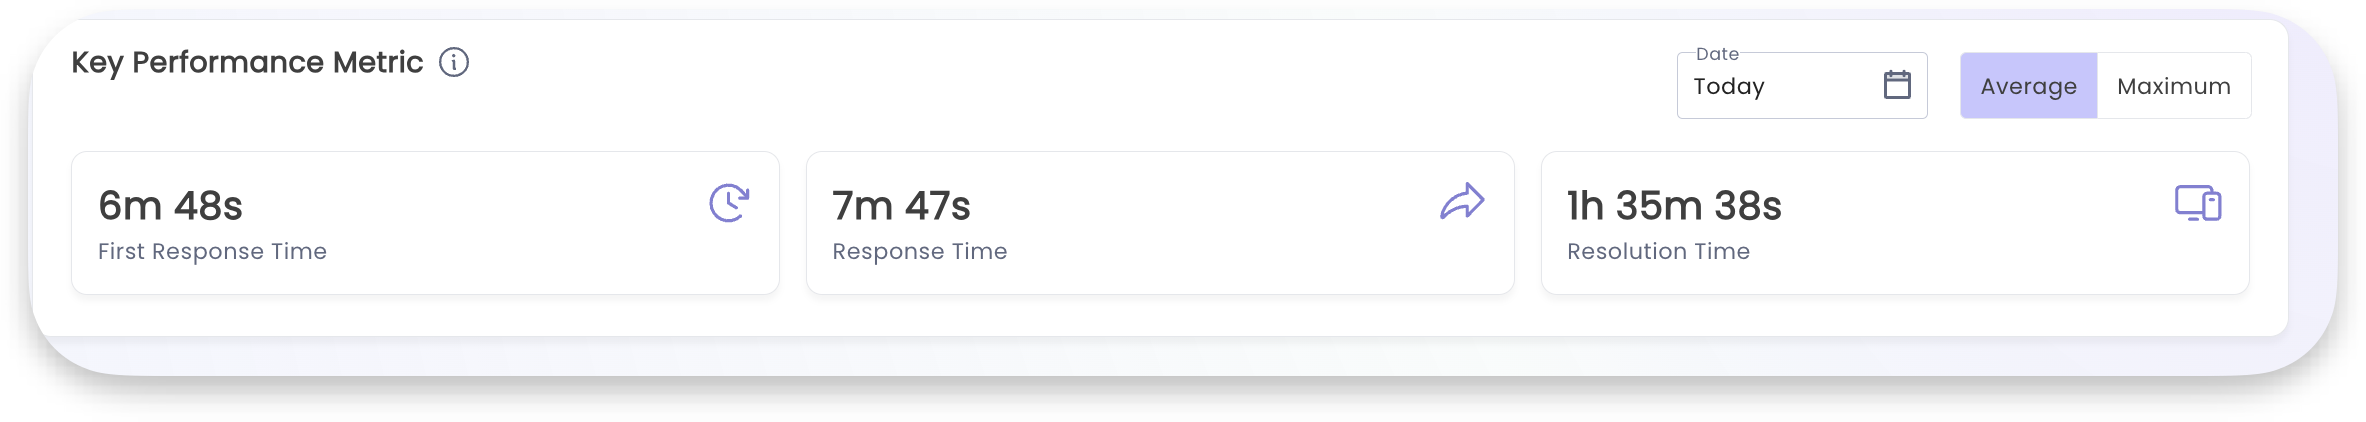
💡 Pro Tip: Use these metrics together to identify bottlenecks in your support process and optimize agent training accordingly.
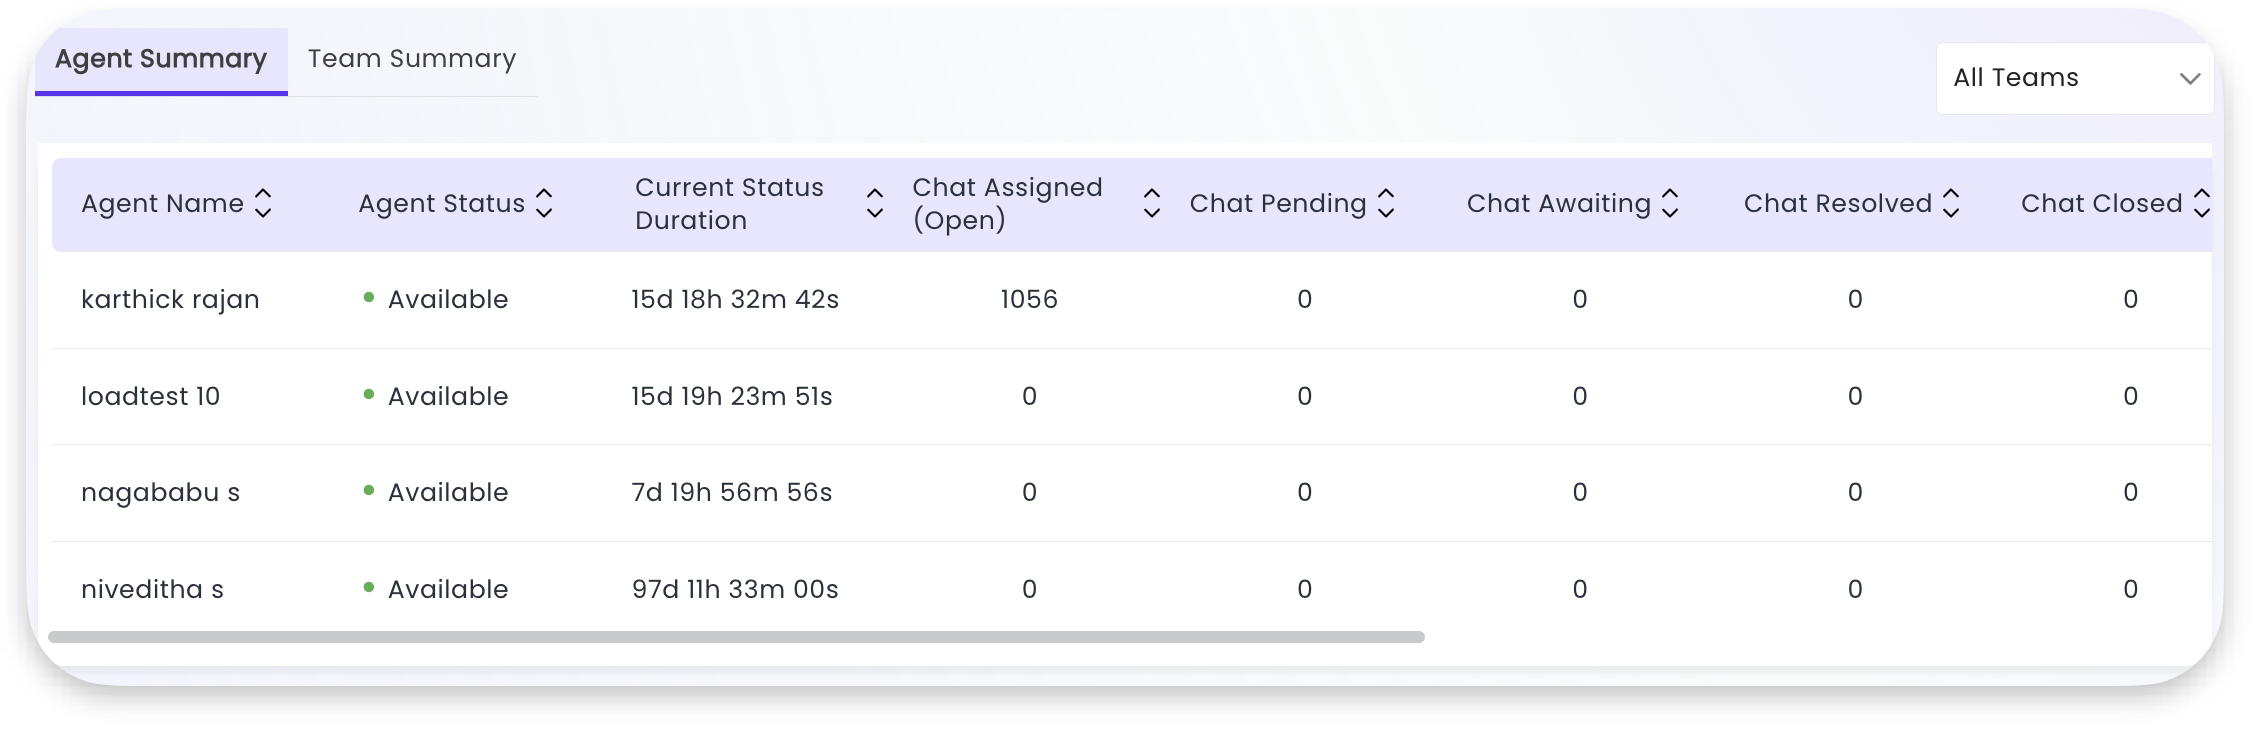
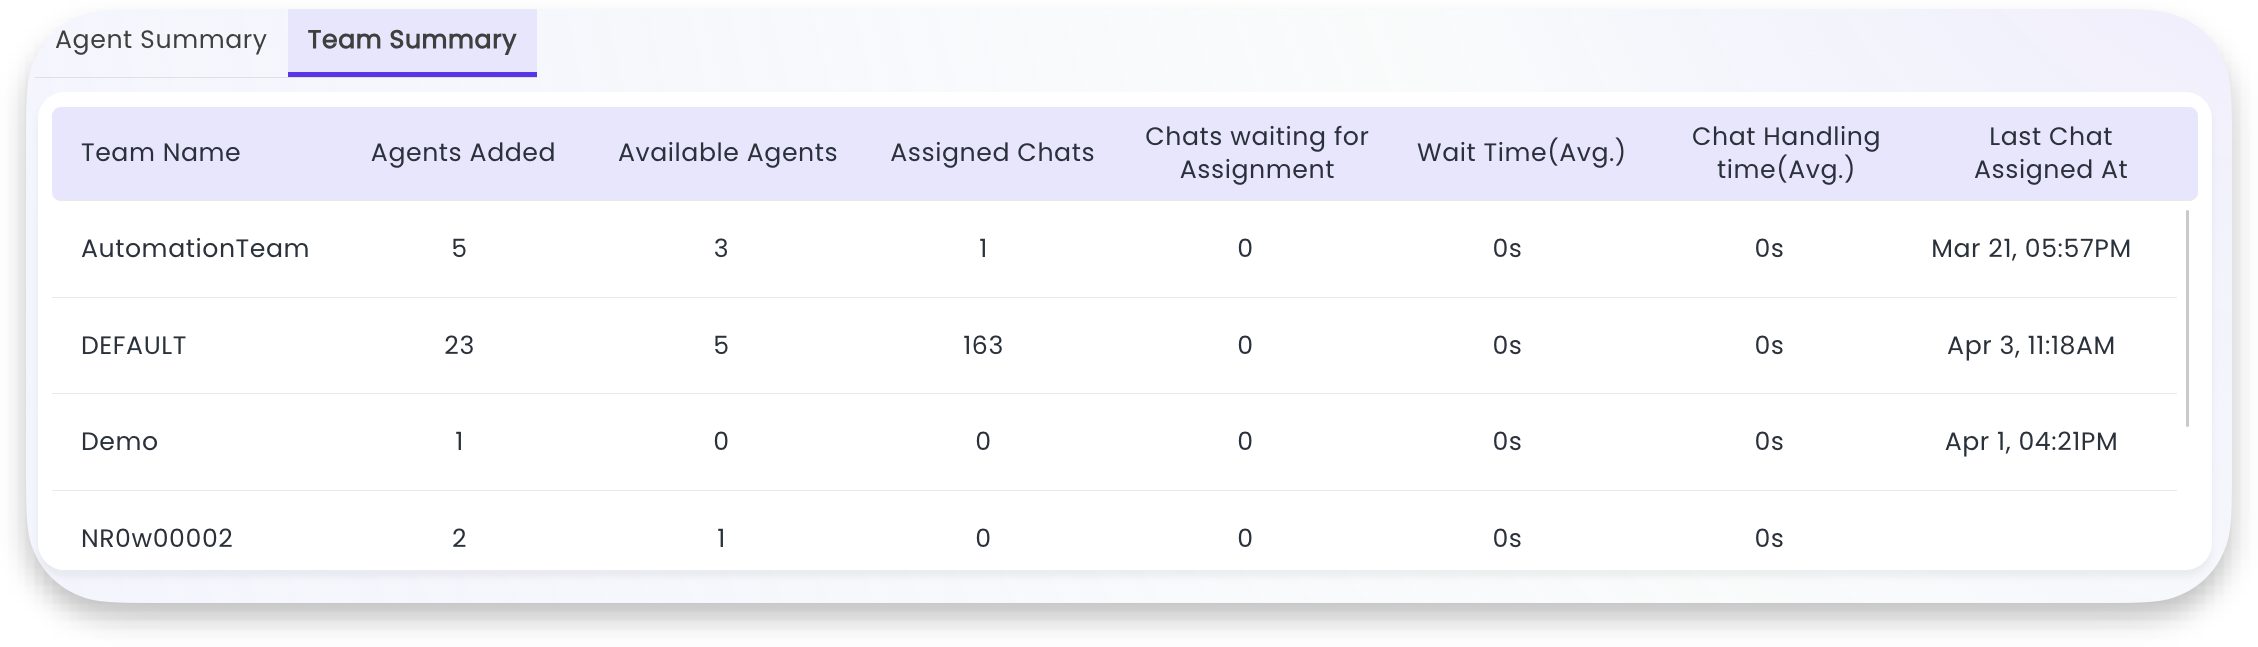
👤 Agent & Team Performance Summary
Get detailed insights into individual and team performance with comprehensive analytics covering:
Individual Agent Metrics
- Personal response times and resolution rates
- Chat volume handled per agent
- Customer satisfaction scores by agent
Team Performance Overview
- Department-level analytics
- Comparative performance across teams
- Resource allocation insights
Key Benefits:
- Identify top performers for recognition and best practice sharing
- Spot training opportunities for improvement
- Optimize team structure and workload distribution
- Track progress on performance goals
⭐ Customer Feedback Integration
Monitor customer satisfaction with integrated feedback analytics from your configured feedback forms.
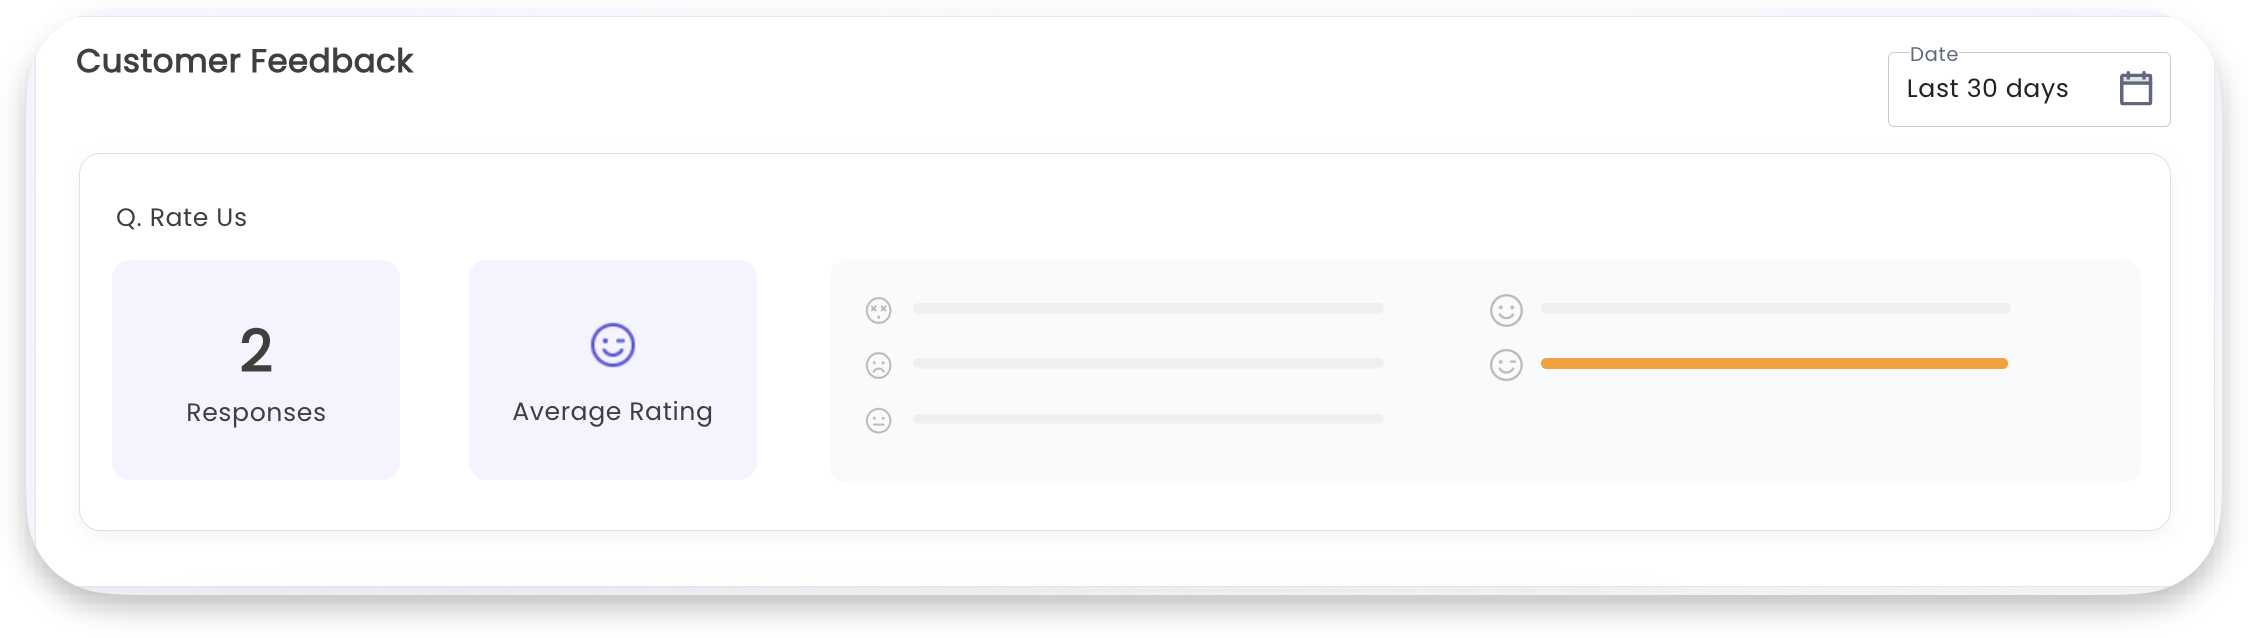
Feedback Insights Include:
- Rating Distributions: Overview of customer satisfaction scores
- Trend Analysis: How satisfaction changes over time
- Agent-Specific Feedback: Individual performance from customer perspective
- Improvement Opportunities: Areas highlighted by customer comments
🎯 Using Your Dashboard Effectively
Best Practices
- Monitor Real-Time Metrics: Check ongoing chats and wait times regularly during peak hours
- Track Daily Trends: Use historical data to predict staffing needs
- Analyze Performance Patterns: Identify successful strategies from top-performing agents
- Act on Feedback: Use customer ratings to drive continuous improvement
Alert Thresholds
Consider setting up monitoring for:
- Wait times exceeding your service level agreements
- Agent utilization rates approaching capacity
- Customer satisfaction scores below acceptable levels
- Assignment queue buildups during peak periods
The live monitoring dashboard updates in real-time, ensuring you always have the most current view of your customer support operations.
Updated 8 months ago